Carbon Audits for the Dairy Farm
Carbon Auditing is an important tool for dairy farming businesses as it not only gives a figure for Greenhouse Gas Emissions per litre of milk produced but can also be used to determine the efficiency of a business and highlight areas where improvements can be made.
75% of the group were about to engage in the preparation of a Carbon Audit for their farm as a requirement of their milk buyer. They are using funding available through the Farm Advisory Service to have a professional advisor calculate their Greenhouse Gas Emissions using a programme called Agrecalc. If you would like to find out more about having a carbon audit done for your business, follow this link
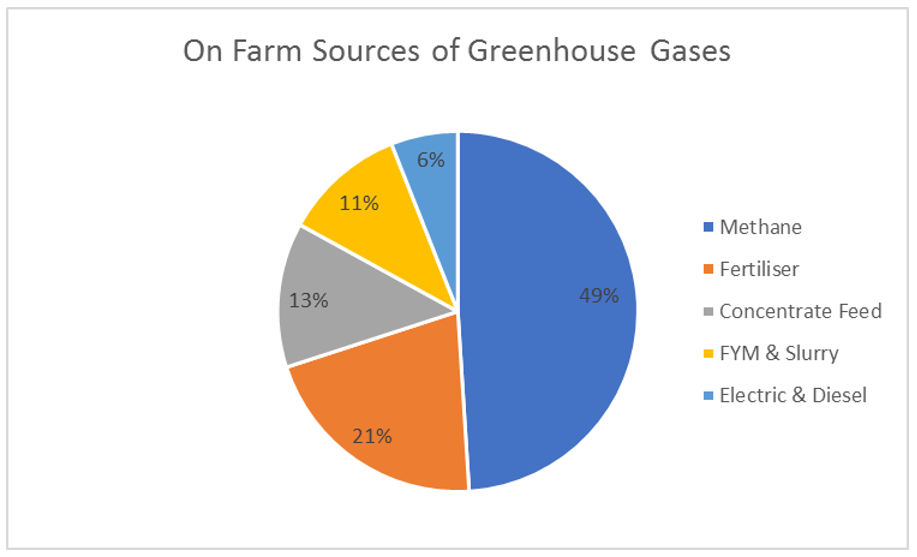
What are Greenhouse Gases (GHGs)?
- Carbon Dioxide (CO2) produced from burning fossil fuels
- Methane (CH4) produced by ruminant animals
- Nitrous Oxide (N2O) released from inorganic fertiliser and organic manures such as slurry and FYM
- Ammonia (NH3) released when cows urinate and from inorganic fertilisers
- Greenhouse Gases are expressed as a CO2 equivalent
Studies by Teagasc in Ireland indicate that the average dairy farm GHG emissions are 1.4kg CO2 /litre, with the top 1/3 of producers achieving 1.04kg CO2/litre.
Electricity & Diesel Use
| Reduction Strategy | Measures | Average Farms' Carbon Footprint | Top 1/3 milk carbon footprint |
|---|---|---|---|
| None | None | 1.14 | 1.04 |
| Improve Efficiency | Improve animal health Enhance soil fertility Increase white clover Increase grass yield & utilisation | -20% | -13% |
| Low Emission Technology | Protected urea Low emission slurry spreading | -5% | -6% |
| Build Soil Carbon | Maintain/Increase permanent pasture Plant hedgerows & trees | -5% | -4% |
| Combined | All | -30% | -23% |
The table above shows the group comparison of average electricity and diesel use. It highlights that there can be a wide variation and there is no correlation between litres sold and energy consumption.
Factors which influence energy use include:
- How much work is done by contractors & do they provide their own diesel?
- Farm layout; is there more than one steading so travelling is increased
- Amount of homegrown cereals increases field work and drying costs
- Number of houses and farm vehicles being supplied with energy
- Other on-farm enterprises.
Reducing Energy Consumption
Case Study 1:
Farm 1 had a previous annual electricity consumption of around 100,000 kWh/year. After installing a heat exchange unit, which uses water to take some of the heat out of the milk before it enters the bulk tank, their consumption reduced by 20,000 kWh, giving an annual saving of approximately £2,730. The capital cost of the Heat Exchange Unit was around £1,800- £2,000. More details on Heat Exchange Units can be found on the AHDB webpage.
Case Study 2:
Farm 6 has recently installed 3 robotic milking units and expected to see an increase in his electricity bill as a result. However, due to the efficiency of the new bulk tank which was installed at the same time, the electricity bill has reduced by £120/month. More information on bulk tanks can be found on the AHDB webpage.
Case Study 3:
Those in the group who have moved from every-day milk collection to every other day have noticed a drop in electricity use as the milk from day 1 in the tank, which is already cold, does most of the cooling of the milk from day 2. There was no financial data available to quantity this.
Reducing Greenhouse Gas Emissions and Improving Farm Efficiency
Work done by Teagasc shows the impact the various GHG reduction strategies can have on emissions, whilst also improving efficiency.
| Reduction Strategy | Measures | Average Farms' Carbon Footprint | Top 1/3 milk carbon footprint |
|---|---|---|---|
| None | None | 1.14 | 1.04 |
| Improve Efficiency | Improve animal health Enhance soil fertility Increase white clover Increase grass yield & utilisation | -20% | -13% |
| Low Emission Technology | Protected urea Low emission slurry spreading | -5% | -6% |
| Build Soil Carbon | Maintain/Increase permanent pasture Plant hedgerows & trees | -5% | -4% |
| Combined | All | -30% | -23% |
The link to the full article can be found here Reducing the carbon footprint of milk production systems
As the table shows, the biggest driver to reduce emissions is to improve efficiency. Some practical examples include:
- Extending the grazing season: this reduces the amount of silage that needs to be made and the amount of slurry to be spread. Every 10 day increase in the grazing season reduces GHG emissions by 1.7% and saves £20/cow
- Improving cows performance and in particular fertility: every month closer to calving heifers at 24months reduces GHG emissions by 0.3% and saves £50/cow
- Increasing nitrogen efficiency: matching fertiliser applications to grass growth, optimising pH, monitor soil P&K status. The use of protected urea early in the grazing season allows more N to be retained for grass growth, reducing GHG by 71%
- Low emissions slurry spreading using a trailing show vs a splash plate will increase the amount of available N from 13kg/N/ha to 25kg/N/ha saving £8.90
- Shifting 20% more slurry applications to the spring rather than summer increases available N by 14kg/ha potentially saving £12.50
Source: Teagasc
The Group met in January 2020 to discuss Carbon Audits.


Sign up to the FAS newsletter
Receive updates on news, events and publications from Scotland’s Farm Advisory Service