Phosphorus Management and the Relationship Between Differing Soils Capacity to Regulate P Availability for Plant Uptake in Scotland
10 December 2021A novel soil specific approach to P management has allowed better use of soil reserves to reduce P fertiliser by using differing soils capacity to regulate P availability for plant uptake and improve sustainability of food production. The approach is novel as it is the first to make use of high-resolution spatial data directly in nutrient use recommendations. This has been made possible due to easily available spatial information to farmers through web resources such as https://soils.environment.gov.scot/. P sorption categories were determined by ranking soils according to their oxalate Fe+Al extractable values. The ranked values were then split into 3 categories of P sorption which were low, medium, and high P sorption capacity (PSC).
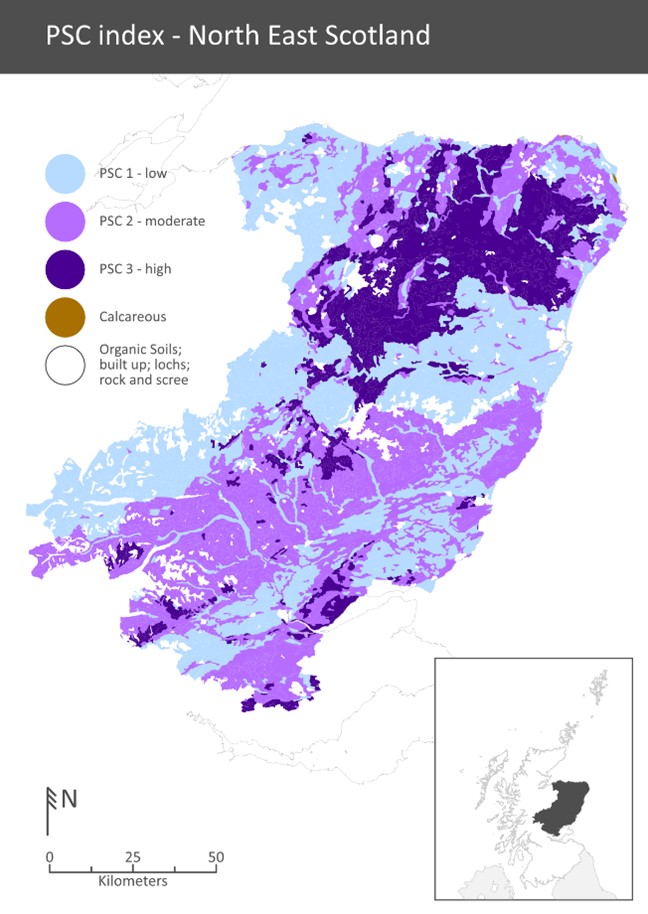
Non-calcareous soil associations have been designated and mapped as index 1, 2 and 3 to reflect inherent soil PSC i.e., low, medium, and high PSC respectively. The data have been separated into 4 Regions: SW Scotland; SE Scotland; NE Scotland; and NW Scotland. NE Scotland has been mapped in Figure 1. Soil association maps and associated PSC indices can be used to aid zone selection as part of GPS soil testing.
Adjustments to P fertiliser recommendations may be made taking account of PSC indices to build-up or run-down to the target soil P tests. For cereal-based arable rotations, and established grass/clover swards, the target soil P status has been set at lower moderate (M-) on PSC 1 and 2 soils but and upper moderate (M+) on PSC 3 soils (Table 1). Similar tables for potato and vegetable crops are reported in FAS/SRUC technical notes TN715-18 (www.fas.scot/publications/technical-notes/). Those soils with a higher PSC that are maintained on target for P represent the greatest erosion risk to water quality as they will contain a higher level of adsorbed P from fertilising. Maintaining soils at target soil P levels is only justified if the land is being actively managed for maximum yields. This requires that other good soil management targets such as pH, nutrient planning as well as adequate drainage status are also considered.
Alex H Sinclair, SAC Consulting
Figure 1. Phosphorus sorption capacity (PSC) from 1 to 3 (low to high) by soil association for non-calcareous mineral soils.
| P sorption capacity | Soil P status | ||||
| Very low (VL) | Low (L) | Mod (M-) | Mod (M+) | High (H) | |
| PSC 1 | +40 | +20 | 0 | -10 | -20 |
| PSC 2 | +60 | +30 | 0 | -20 | -30 |
| PSC 3 | +80 | +40 | +20 | 0 | -40 |
Table 1. Effect of P sorption capacity indices on adjustments (kg P2O5/ha/year) to build-up or run-down soil P status for grass, cereals, oilseed rape and fodder crops
Sign up to the FAS newsletter
Receive updates on news, events and publications from Scotland’s Farm Advisory Service