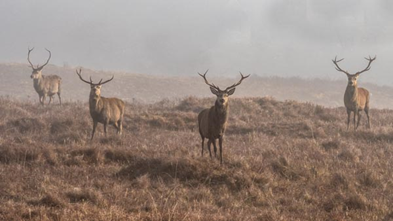
Habitat Impact Assessment: Best Practice Guidance on the Management of Wild Deer in Scotland
Habitat Impact Assessment as explained in the Best practice Guides (BPGs) is a methodology for measuring and assessing current impact of grazing on habitats.
Deer are dependent on the habitat as well as impacting on it. Like a farmer knowing about his soils, the deer manager should know something about the condition of the habitat. To manage deer sustainably, a manager should understand how deer impact on the habitat over time, and how this effects habitat condition.
By measuring and recording the impacts of deer on habitat condition, it makes it easier to monitor whether land management objectives are being achieved.
The Best Practice Guides (BPGs) on Habitat Impact Assessment aim to help land managers to set up a baseline that allows changes in impacts to be measured over time. They offer guidance on how to design, collect and interpret the results.
Further detailed information regards BPGs can be found online on the Best Practice Guides website.
The first stage is to plan and establish a base line. It may take time to do this but if done properly will make the later stages quicker and produce more worthwhile results. Annual monitoring should take a relatively short period of time thereafter.
Planning and setting up
Monitoring involves setting out fixed-point quadrats over the landscape. Different habitats will be impacted differently therefore fixed-points should be set up on each habitat.
- use a habitat map to inform what habitats are present and where they are
- each habitat should have a minimum of 30 fixed points. These should be set up as randomly as possible across the habitat.
- establish the baseline by setting out the marked ('permanent') plots. Plots should be marked by wooden posts (approximately 5 x 5 x 20cm) and their location recorded by GPS. Posts or tags should be small enough to minimise their attention by deer; hammered below vegetation height, or located at a fixed distance (e.g. 10m) from the plot
Monitoring
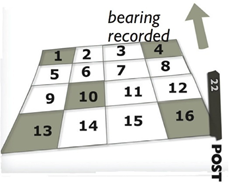
Each fixed point is made up of a 2m x 2m grid divided into 16 squares.
Download the monitoring field sheet from the website to complete and use a different monitoring sheet for each habitat.
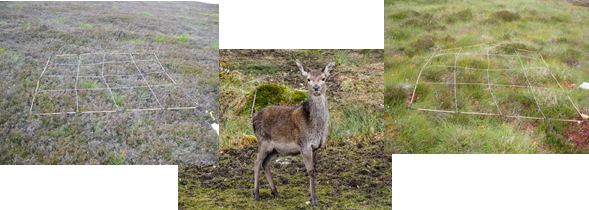
Complete the monitoring cards:
- for dwarf shrub cards
- in all quadrats record presence or absence of heather
- in selected quadrats assess heather (or blaeberry if heather absent) browsing of last years shoots and vegetation height
- in the whole plot assess dwarf shrub heath trampling
- using breakage of heather stems & the presence or absence of dung & note mammal species
- for blanket bog cards
- in all quadrats record presence of bog moss
- in all quadrats record hoof prints on bare peat
- in selected quadrats assess heather browsing of last years shoots & vegetation height
- in the whole plot assess the presence or
- absence of deer or hare dung.
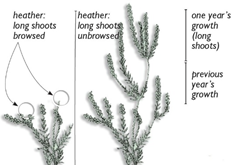
To assess heather browsing take 3-4 handfuls of heather within each of the five shaded subplots and count the number of stems that have been browsed
Browsing levels on heather stems
- LIGHT: <33% long shoots browsed
- MODERATE: 33-66% long shoots browsed
- HEAVY: >66% long shoots browsed
- Categorise plot according to the most frequent category of quadrats.
Identifying changes in impacts can help inform decisions on future deer management in the context of that estate or Deer Management Group to achieve objectives.
Generally a “sustainable” deer density will vary between <5 deer/km2 on fragile blanket bog to 10-20 on more productive dwarf shrub heath. Setting a target deer density will depend upon the proportions of each habitat type and any other significant variable e.g. woodland, other herbivores, deer migration and mortality.
Useful Links and Downloads
Sign up to the FAS newsletter
Receive updates on news, events and publications from Scotland’s Farm Advisory Service

