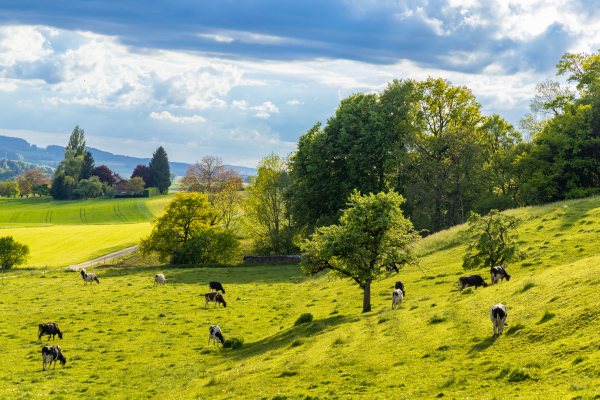
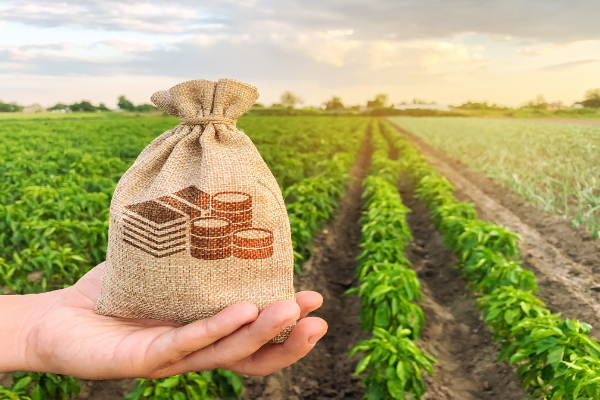
Profit Snapshot 2023 – 2024: How does your Farm Business Measure Up?
14 April 2025Every year the Scottish Farm Business Survey produces national group average datasets from 400 Scottish farms for you to benchmark your business against to assess your farm business performance.
Take these steps for quick comparison:
- Visit the Whole Farm Benchmarks Tool 2023-2024
- Choose your farm type on the left from the drop down box.
- Dig out your latest set of farm accounts from your accountants and using the table below, compare your % net profit against Farm Business Income as a % of Output as these figures are comparable.
- Again, using the table below, compare your Whole Farm Gross Margin
- Are you in the top 25% of performing farms or closer to the average figure?
To compare your farm accounts data in further detail and see what goes into these figures to gain further insights explore the Whole Farm Benchmarks Tool 2023-2024 further.
Profit Snapshot 1: Crop year 2023 - 2024
| Farm Type | Top 25% | Average | Top 25% | Average | |
| Dairy | 12 | 56 | 52 | ||
| General Cropping | 20 | 78 | 73 | ||
| Specialist Cereals | 11 | 73 | 66 | ||
| Mixed farms | 9 | 23 | 61 | ||
| Livestock farms | Whole Farm Gross Margin as % of Output | ||||
|---|---|---|---|---|---|
| ____________ | Average | Top 25% | Average | ||
| Specialist Beef (LFA) | 11 | 73 | 64 | ||
| Mixed cattle & Sheep (LFA) | 9 | 69 | 63 | ||
| Specialist Sheep (LFA) | 2 | 70 | 68 | ||
Output: From all farm enterprises, subsidies and diversification that uses farm resources.
Farm Business Income (FBI): Includes income from farming, support payments and farm diversification. FBI reflects actual incomes of farm businesses and is equivalent to net profit.
Whole Farm Gross Margin: Your total farm output minus your total variable costs.
Questions for Dairy and Livestock farmers
How does your business compare to farms similar to your own for some simple performance measures?
- Choose farm type from this page Whole Farm Benchmarks Tool 2023-2024
- Identify the performance measures from your farm productivity and accounts data
- Using the table below, how does your business compare?
For more information visit the Whole Farm Benchmarks Tool 2023-2024. Investigate your business financial performance in more detail against farms similar in size and type to your own.
Profit Snapshot 2: Crop year 2023 - 2024
| Farm Type | Performance measure | Number of Farms | ||||
| Dairy | 42 | Top 25% | Average | |||
| Litres of milk / cow Milk price: p / litre Cost of concentrates as % of output | 7491 38.1 28% | 7784 38.1 30% | ||||
| Specialist Beef with sheep (LFA) | 91 | Selected variable cost | % Ewes to Ram | |||
| Top 25% | Average | Top 25% | Average | |||
| Cost of concentrates as % of output Lambs disposed | 10 | 14 | 142 | 139 |
||
| Mixed Cattle & Sheep (LFA) | 52 | Selected variable cost | % Ewes to Ram | |||
| Top 25% | Average | % Rough Grazing under 80% | % Rough Grazing over 80% |
|||
| Cost of concentrates as % of output Lambs disposed | 11 | 13 | 147 | 93 |
||
| Specialist Sheep (LFA) | Selected variable cost | % Ewes to Ram | ||||
| Top 25% | Average | Northern | Southern | |||
| Cost of concentrates as % of output Lambs disposed | 9 | 10 | 69 | 100 |
||
The farm types are based on the balance of enterprises.
- Specialist Sheep
Farms in the LFA with most production coming from sheep (mainly hard hill). - Specialist Beef (LFA)
Farms in the LFA with most production coming from beef. - Cattle & Sheep (LFA)
Farms in the LFA with production balanced between beef and sheep. - Specialist Cereals
Farms where most production coming from cereals and oilseeds. - General Cropping
Farms where a significant share of crop production includes intensive crops like potatoes. - Dairy
Farms where most production comes from dairy cows. - Mixed
Lowland farms where no enterprise dominates production


Related articles
Rural Business


Farm Accounts
Sign up to the FAS newsletter
Receive updates on news, events and publications from Scotland’s Farm Advisory Service