Business and Policy August 2025 – Milk
31 July 2025Milk production data
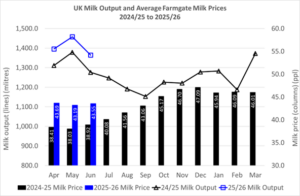
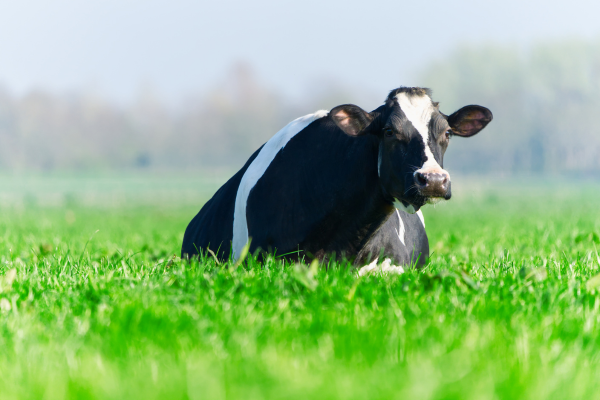
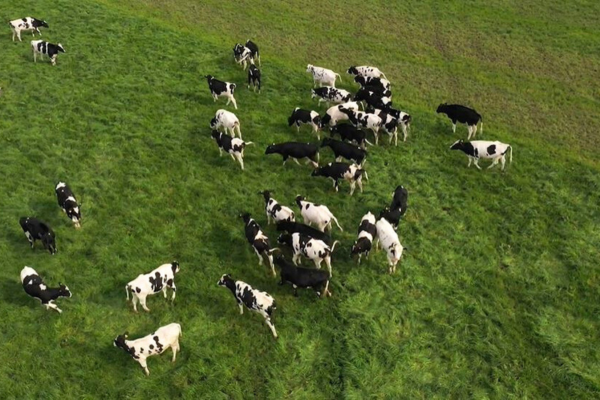
While milk production is declining from the spring peak, as it usually does at this time of year; production is still well ahead of the same time last year, despite the very warm dry weather limiting grass availability in some areas. The latest data from AHDB estimates the GB milk volume for June at 1,105 million litres, 63 mlitres more than the previous June (+6%). Daily production for the week ending 19th July was 34.26 mlitres, 2.1% less than the previous week, but 3.9% above the same week last year – which equates to an extra 1.3 mlitres per day. For the UK, June production was 1,364 mlitres, which was 94 mlitres less than the previous month but 6.9% more than June 2024.
Farm-gate prices
The Defra farm-gate milk price for June was 43.55ppl, up slightly by 0.36ppl from the previous month and 12% higher than 12 months ago. While milk volumes will now be declining until the trough in September, before they pick up again with Autumn calvers, it is unlikely that we will see milk price rises going forward in the short-term.
| Milk Prices for July/Aug 2025 Scotland | Standard Ltr ppl | ||
|---|---|---|---|
| First Milk2 | Aug | 44.85 | |
| Müller - Müller Direct - Scotland 1, 3 | Aug | 42.25 | |
| Grahams1,4 | Jul | 40.00 | |
| Arla Farmers2 | Jul | 47.87 | |
| Lactalis / Fresh Milk Co.2 | Jul | 42.13 | |
| 1 | Liquid standard litre – annual av. milk price based on supplying 1m litres at 4.0% butterfat, 3.3% protein, bactoscan = 30, SCC = 200 unless stated otherwise. | ||
| 2 | Manufacturing standard litre - annual av. milk price based on supplying 1m litres at 4.2% butterfat, 3.4% protein, bactoscan = 30, SCC = 200 unless stated otherwise. | ||
| 3 | Includes 1.00ppl Müller Direct Premium. Haulage deducted depending on band for 2023 vs 2021 litres, ranging from -0.25 to -0.85ppl. | ||
| 4 | Graham’s ‘A’ milk price | ||
Dairy commodities & market indicators
Apart from cream, there was virtually no change in the average July monthly price for butter, skim milk powder (SMP) and mild cheddar. Cream prices have benefited from increased demand on the back of the hot summer, an abundant strawberry crop and good timing with the Wimbledon Tennis Championships during the first two weeks of July! While butter stocks are still reported to be tight, the EU butter price has been falling, putting downward pressure on the UK price. SMP and mild cheddar markets have been quiet, with little traded. As a result, there was very little change in both market indicators AMPE and MCVE from last month, down 0.17ppl and 0.31ppl respectively. The Milk Market Value indicator dropped just 0.28ppl to 42.18ppl for July.
The latest GDT auction on 15th July was the first positive result since the 6th of May (the last four auctions returned a negative result) with a 1.1% increase in the average price across all products reaching $4,380/t. The biggest drop was in cheddar, down 5.6% to $4,589/t and SMP had the highest percentage increase at 2.5%, up to $2,785/t. Butter remained the same from the previous auction, at $7,492/t.
| UK dairy commodity prices (£/tonne) | Jul | Jun | Jan |
|---|---|---|---|
| 2025 | 2025 | 2025 | |
| Butter | 6,150 | 6,160 | 6,180 |
| Skim Milk Powder (SMP) | 1,970 | 1,980 | 2,090 |
| Bulk Cream | 2,774 | 2,657 | 2,630 |
| Mild Cheddar | 3,890 | 3,900 | 3,990 |
| UK milk price equivalents (ppl) | Jul | Jun | Jan |
|---|---|---|---|
| 2025 | 2025 | 2025 | |
| AMPE | 42.47 | 42.64 | 44.01 |
| MCVE | 42.10 | 42.41 | 43.50 |
© AHDB [2025]. All rights reserved.
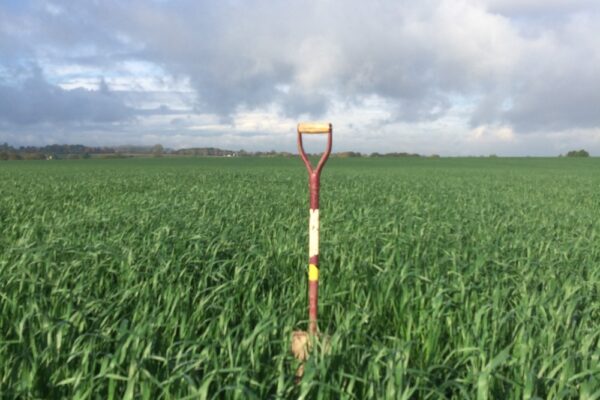
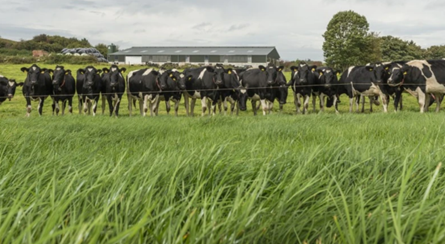
Grass growth and quality
The latest data from AHDB’s Forage for Knowledge programme (24th July) shows that from mid-June onwards, grass growth rates have struggled and have dipped well below those of last year. The current average growth rate for GB is 35.7kgDM/ha and average quality is 20.4% dry matter, 11.6ME and 18.5% crude protein.
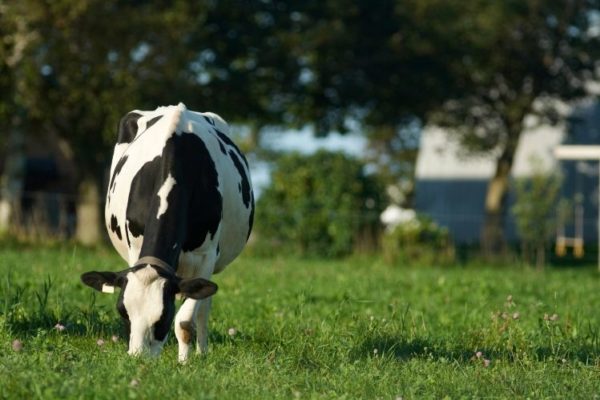
For a 650kg cow, eating 15kg of dry matter from grass, this should support around Maintenance(M)+19 litres. However, if buffer feeding (or if it is a very wet day and grass dry matter content drops), then dry matter intake from grass will be a lot less. If only 12kg of dry matter from grass is consumed, then milk from grass is only around M+12 litres. It is therefore important to keep a close eye on body condition to ensure cows are not losing excessively throughout the grazing season.
Carrying out grass analysis to assess quality is a useful tool to help your nutritionist formulate buffer rations to help meet energy and protein requirements. As the season progresses and days get shorter, cows graze less so it is important not to overestimate how much milk grass is supporting.
How do you measure up?
Kingshay have recently released their annual Dairy Costings Focus Report for 2025. This is an excellent publication with which you can benchmark the performance of your own herd against key performance indicators, such as milk from forage, concentrate use per litre and margin over purchased feeds.
Herd performance can be benchmarked according to region, calving production system, level of milk output and also covers crossbred, channel island and organic herds. The report also details health and fertility trends over the last year and can be accessed here: https://www.kingshay.com/wp-content/uploads/Dairy-Costings-Focus-Report-2025.pdf
Lorna MacPherson, lorna.macpherson@sac.co.uk


Sign up to the FAS newsletter
Receive updates on news, events and publications from Scotland’s Farm Advisory Service