Using Slurry to Save on Fertiliser and Improve Silage Quality
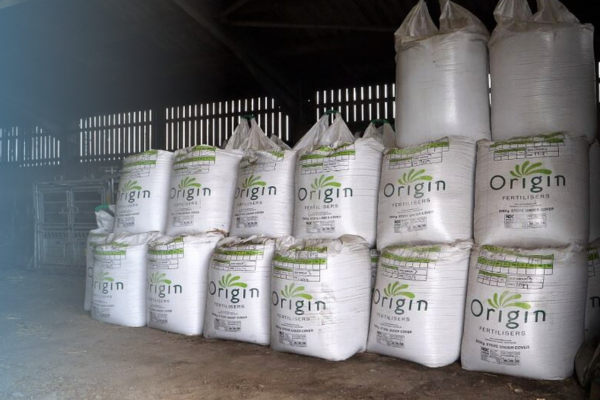
3 July 2026For several months now, energy prices have been trending upwards after the start of the conflict in the Middle East. This has seen oil reach a peak of $100 US/barrel forcing a significant increase in fuel prices back in the UK. This has had a knock-on effect on fertiliser prices with AHDB reporting prices over £520/tonne for Ammonium Nitrate fertiliser in April.
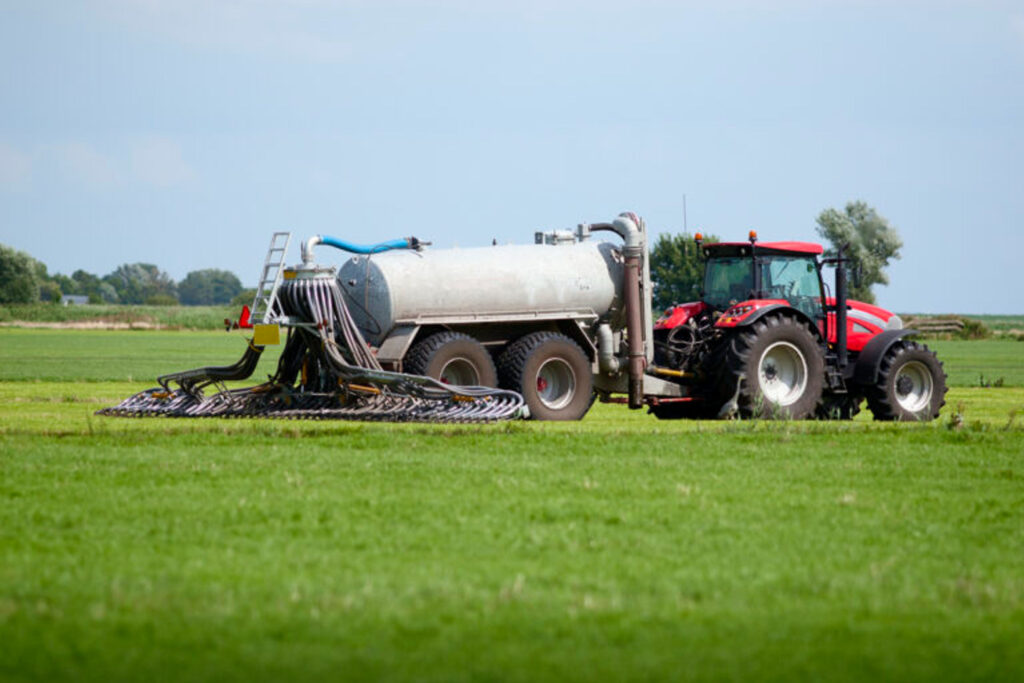
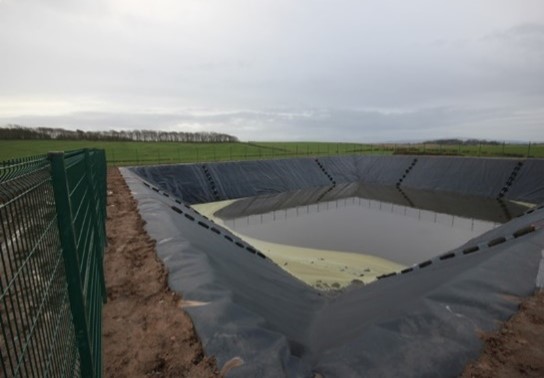
This has seen many farmers seek to reduce reliance on imported fertiliser and again look at the value of home-produced slurry. Slurry is a good source of Nitrogen, Phosphorus, Potassium and Sulphur as well as helping to increase organic matter in soils. As shown in Table 1, a 2500-gallon (11m3) slurry tanker can have a nutritional value of around £80 when compared to buying in the same nutrients in artificial form.
Table 1. Assuming slurry at 6% DM and fertiliser price based on AN at £514/t, TSP at £600/t and MOP at £382/t
| N (kg) * | P (kg) | K (kg) | Total | |
|---|---|---|---|---|
| Cattle Slurry (m3) | 2.6 | 1.2 | 3.2 | |
| Value/m3 (May ‘26) | £3.87 | £1.56 | £2.05 | £7.48 |
| 11m3 (2500-gallon) tanker NPK | 42.6 | 13.6 | 36.4 | |
| 11m3 (2500-gallon) tanker value | £42.57 | £17.16 | £22.55 | £82.28 |
*Total Nitrogen
Ensuring Good Silage
When producing silage, substantial quantities of phosphorus and potassium are removed from the field with every cut. Replacing these nutrients is essential to maintain soil fertility and sustain future yields. Table 2 highlights the typical offtake of P and K from first, second and third-cut silage crops based on yield.
Table 2. Appropriate Nitrogen rates and P & K offtake from established grassland according to yield
| Yield (t/ha) | N | P Offtake | K Offtake | |
|---|---|---|---|---|
| 1st Cut Silage | 12-23 | 110 | 20-39 | 72-138 |
| 2nd Cut Silage | 7-12 | 90 | 12-20 | 42-72 |
| 3rd Cut Silage | 6-9 | 70 | 10-15 | 10-54 |
While slurry can replace a significant proportion of these nutrients, the exact requirement will depend on existing soil fertility levels and yield of silage. Regular soil sampling remains one of the most important management tools available, allowing nutrient applications to be matched to crop and soil demands, optimising yield and spend on fertiliser. Sampling the nutrient content of slurry will help to inform any nutrient budgets and there can be a significant difference depending on the type of system you operate.

Consider the Needs of your Crop
Table 3 shows both the offtake and nutrient requirements of a bulky second cut of silage. In this example we can see that 22m3/ha (2000 g/ac) of slurry will provide enough P & K to meet the offtake of the silage crop. Although slurry provides useful amounts of nitrogen, this is not enough to meet the nitrogen required for higher yielding crops, particularly earlier-cut silage. As such nitrogen requirements should be topped up by artificial fertiliser. While not shown here, higher rates of slurry can lead to potassium applications of 90 kg/ha or more. This should be avoided as overapplications can lead to hypomagnesemia (grass staggers), as the magnesium is locked up by the abundance of K.
Table 3. Nutrients required for 2nd cut silage
| Rate/Yield | N (kg) | P (kg) | K (kg) | |
|---|---|---|---|---|
| Nutrient Required | ||||
| 2nd Cut | 12t/ha | 90 | 20 | 72 |
| Nutrient Supplied | ||||
| Slurry, Precision applied | 22m3/ha (2000 g/ac) | 17 | 26 | 70 |
| Fertiliser (27% N) | 275kg/ha (2.2 cwt/ac) | 75 | 0 | 0 |
| Total | 92 | 26 | 70 | |
Requirements are Determined by Yield
Table 4 demonstrates that different cuts of silage require different requirements based off yield. Whereas 22m3/ha (2000 g/ac) satisfied P & K demand for 2nd cut, only 17m3/ha (1500 g/ac) is required to satisfy P & K demands for a lower yielding 3rd cut.
Table 4. Nutrients required for 3rd cut silage
| Rate/Yield | N (kg) | P (kg) | K (kg) | |
|---|---|---|---|---|
| Nutrient Required | ||||
| 3rd Cut | 9t/ha | 70 | 15 | 54 |
| Nutrient Supplied | ||||
| Slurry, Precision applied | 17m3/ha (1500 g/ac) | 13 | 20 | 53 |
| Fertiliser (27% N) | 200kg/ha (1.6 cwt/ac) | 54 | 0 | 0 |
| Total | 67 | 20 | 53 | |
As fertiliser costs continue to fluctuate, slurry should be viewed as an asset. As recent years has shown, fertiliser prices are heavily influenced by global market conditions and can vary significantly, making the efficient use of slurry an increasingly important part of managing input costs, especially with the threat of an incoming tax on imported fertilisers.
Put a Nutrient Management Plan in Place
A nutrient management plan which is reviewed throughout the season according to crop yields, and the latest soil analysis will ensure this valuable source of nutrients is optimised. With informed nutrient planning, farmers can protect their business from global price rises whilst maintaining productive and resilient grassland systems.


Sign up to the FAS newsletter
Receive updates on news, events and publications from Scotland’s Farm Advisory Service